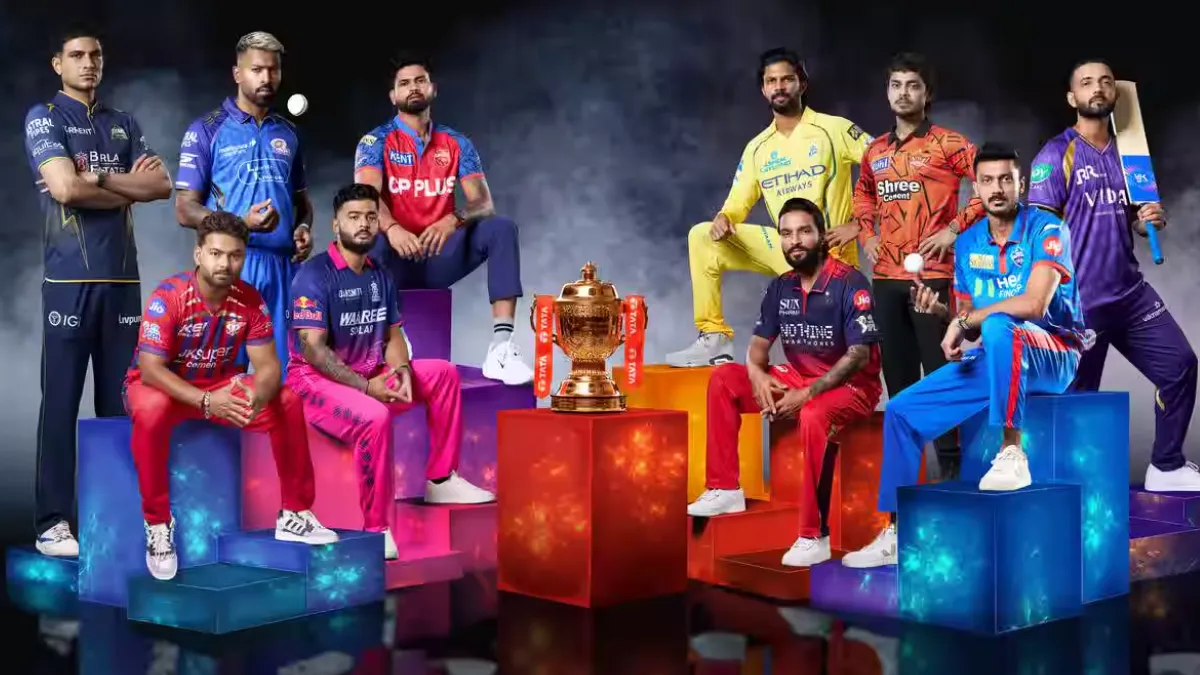
The debate around the IPL All Time Best Team Ranking has been a constant topic among cricket fans since the Indian Premier League began in 2008. Over the years, supporters of different franchises have passionately argued about which team truly deserves to be called the greatest in IPL history. Some fans believe the number of trophies decides the best team, while others focus on consistency, playoff appearances, or win percentages.
To resolve this long-standing debate with facts rather than emotions, a detailed ranking has been created using data from 18 IPL seasons (2008–2025). Instead of relying on only one metric, the ranking analyzes multiple performance indicators to determine which team has truly dominated the league across its entire history.
At the same time, cricket trends change quickly. New franchises have emerged, player squads evolve, and the competitive balance of the league shifts every few years. To reflect the modern era of the tournament, another ranking has also been created based on performance over the last four IPL seasons. This gives a clear picture of the teams that have dominated the league in recent years.
So this analysis presents two perspectives:
- The historical IPL All Time Best Team Ranking based on 18 seasons.
- The modern IPL team ranking based on the last four seasons.
While the all-time ranking includes only teams that have played at least 10 seasons, the four-year ranking includes all 10 current IPL franchises, including newer teams like Gujarat Titans and Lucknow Super Giants.
Let’s first understand the methodology used to calculate the IPL All Time Best Team Ranking.
Methodology: How the IPL All Time Best Team Ranking Was Calculated
Ranking IPL teams purely based on trophies would not accurately reflect overall performance. Some teams may have fewer titles but have consistently reached playoffs or finals over many years.
To ensure fairness and accuracy, teams were evaluated using four key performance metrics.
Each metric was given equal importance in the ranking.
1. Match Winning Percentage
The most basic goal in any sport is to win matches. A team that consistently wins games across seasons demonstrates strong squad depth, strategy, and performance.
Teams with higher win percentages received more points in this category.
2. Playoff Qualification Rate
Reaching the IPL playoffs is the primary target for every franchise at the start of the season.
The top four teams at the end of the league stage qualify for the playoffs, making this a strong indicator of consistency.
Teams that reached the playoffs more frequently were rated higher.
3. Final Qualification Rate
The IPL begins with multiple teams, but by the end of the tournament only two teams remain in the final.
Reaching the final consistently shows the ability to perform under high-pressure knockout matches.
Teams with more finals appearances received higher points.
4. Trophy Conversion Rate
IPL finals are often described as pressure games, where mental strength matters as much as cricketing ability.
Therefore, another crucial metric was how efficiently teams converted final appearances into championship titles.
Teams that won a higher percentage of finals received better ratings.
IPL Team Rating System
Each of the four metrics carried 250 rating points.
The best-performing team in each category received the full 250 points.
Other teams were awarded points relative to how far they were behind the leader.
This means the maximum possible rating for a team was 1000 points.
Teams closer to this total ranked higher in the IPL All Time Best Team Ranking.
Match Winning Percentage: Chennai Leads, Mumbai Close Behind
The first metric evaluated was match-winning percentage, which measures overall success across all matches played.
IPL Teams Match Winning Rating
| Rank | Team | Matches | Wins | Win % | Rating |
|---|---|---|---|---|---|
| 1 | CSK | 253 | 142 | 56% | 250 |
| 2 | MI | 277 | 151 | 55% | 246 |
| 3 | KKR | 265 | 135 | 51% | 228 |
| 4 | RCB | 271 | 132 | 49% | 219 |
| 5 | RR | 236 | 114 | 48% | 214 |
| 6 | SRH | 196 | 93 | 47% | 210 |
| 7 | PBKS | 263 | 119 | 45% | 201 |
| 8 | DC | 266 | 118 | 44% | 196 |
Note: The team with the highest win percentage receives the full 250 points.
Analysis
Chennai Super Kings have played 253 matches and won 142, giving them a 56% win rate, the highest among all franchises.
Mumbai Indians are a very close second with a 55% win percentage, reflecting their long-term competitiveness.
Kolkata Knight Riders, Royal Challengers Bengaluru, and Rajasthan Royals follow closely behind in the rankings.
Playoff Qualification: Chennai Dominates Again
Reaching the playoffs consistently is a strong indicator of a team’s stability and competitiveness across seasons.
IPL Teams Playoff Qualification Rating
| Rank | Team | Tournaments | Playoffs | Playoff % | Rating |
|---|---|---|---|---|---|
| 1 | CSK | 16 | 12 | 75% | 250 |
| 2 | MI | 18 | 11 | 61% | 203 |
| 3 | RCB | 18 | 10 | 56% | 187 |
| 4 | SRH | 13 | 7 | 54% | 180 |
| 5 | KKR | 18 | 8 | 44% | 147 |
| 6 | RR | 16 | 7 | 44% | 147 |
| 7 | DC | 18 | 6 | 33% | 110 |
| 8 | PBKS | 18 | 3 | 17% | 57 |
Analysis
Chennai Super Kings again dominate this category with 12 playoff appearances in 16 seasons, resulting in a 75% playoff qualification rate.
Mumbai Indians come second with 11 playoff appearances, while Royal Challengers Bengaluru take third place.
Punjab Kings rank last, having qualified for playoffs only three times in 18 seasons.
Final Appearances: Chennai’s Incredible Record
Reaching the IPL final consistently is a sign of true championship pedigree.
IPL Teams Final Qualification Rating
| Rank | Team | Tournaments | Finals | Final % | Rating |
|---|---|---|---|---|---|
| 1 | CSK | 16 | 10 | 63% | 250 |
| 2 | MI | 18 | 6 | 33% | 131 |
| 3 | SRH | 13 | 3 | 23% | 91 |
| 4 | KKR | 18 | 4 | 22% | 87 |
| 5 | RCB | 18 | 4 | 22% | 87 |
| 6 | RR | 16 | 2 | 13% | 52 |
| 7 | PBKS | 18 | 2 | 11% | 44 |
| 8 | DC | 18 | 1 | 6% | 24 |
Analysis
Chennai Super Kings have reached the IPL final 10 times, far more than any other team.
This extraordinary consistency places them firmly at the top in this category.
Mumbai Indians are second with six finals appearances, while Kolkata Knight Riders and Royal Challengers Bengaluru have each played four finals.
Trophy Conversion: Mumbai Indians Excel
While reaching finals is impressive, winning them is what ultimately defines champions.
IPL Trophy Winning Teams Rating
| Rank | Team | Finals | Titles | Conversion % | Rating |
|---|---|---|---|---|---|
| 1 | MI | 6 | 5 | 83% | 250 |
| 2 | KKR | 4 | 3 | 75% | 226 |
| 3 | CSK | 10 | 5 | 50% | 151 |
| 4 | RR | 2 | 1 | 50% | 151 |
| 5 | SRH | 3 | 1 | 33% | 99 |
| 6 | RCB | 4 | 1 | 25% | 75 |
| 7 | PBKS | 2 | 0 | 0% | 0 |
| 8 | DC | 1 | 0 | 0% | 0 |
Analysis
Mumbai Indians lead this category with an 83% final-to-title conversion rate, winning five of the six finals they have played.
Kolkata Knight Riders also boast an impressive 75% success rate, having won three of their four finals.
Chennai Super Kings have won five titles from ten finals, giving them a 50% conversion rate.
IPL All Time Best Team Ranking (Overall)
Combining all four performance categories provides the final IPL All Time Best Team Ranking.
Overall IPL Teams Final Rating
| Rank | Team | Total Rating |
|---|---|---|
| 1 | CSK | 901 |
| 2 | MI | 830 |
| 3 | KKR | 688 |
| 4 | SRH | 580 |
| 5 | RCB | 568 |
| 6 | RR | 564 |
| 7 | DC | 330 |
| 8 | PBKS | 302 |
Final Verdict
Based on the data, Chennai Super Kings rank as the No.1 team in IPL history with 901 rating points.
Mumbai Indians follow closely with 830 points, confirming their status as the league’s second-best franchise.
Kolkata Knight Riders take third place, while Punjab Kings rank last among long-standing franchises.
IPL Team Rankings Over the Last Four Years
While historical rankings tell one story, the IPL has evolved significantly in recent years.
New franchises like Gujarat Titans and Lucknow Super Giants have quickly become competitive teams.
To capture the current era, rankings were also calculated using data from the last four seasons.
Match Winning Performance (Last 4 Years)
IPL Teams Match Winning Rating (Last 4 Years)
| Rank | Team | Matches | Wins | Win % | Rating |
|---|---|---|---|---|---|
| 1 | GT | 60 | 37 | 62% | 250 |
| 2 | RCB | 60 | 34 | 57% | 230 |
| 3 | LSG | 58 | 30 | 52% | 210 |
| 4 | KKR | 56 | 28 | 50% | 202 |
| 5 | RR | 61 | 30 | 49% | 198 |
| 6 | PBKS | 59 | 28 | 47% | 190 |
| 7 | DC | 56 | 25 | 45% | 181 |
| 8 | MI | 60 | 26 | 43% | 173 |
| 9 | CSK | 58 | 25 | 43% | 173 |
| 10 | SRH | 58 | 25 | 43% | 173 |
Playoff Qualification (Last 4 Years)
IPL Teams Playoff Qualification Rating (Last 4 Years)
| Rank | Team | Tournaments | Playoffs | Playoff % | Rating |
|---|---|---|---|---|---|
| 1 | GT | 4 | 3 | 75% | 250 |
| 2 | RCB | 4 | 3 | 75% | 250 |
| 3 | LSG | 4 | 2 | 50% | 167 |
| 4 | RR | 4 | 2 | 50% | 167 |
| 5 | MI | 4 | 2 | 50% | 167 |
| 6 | KKR | 4 | 1 | 25% | 83 |
| 7 | PBKS | 4 | 1 | 25% | 83 |
| 8 | CSK | 4 | 1 | 25% | 83 |
| 9 | SRH | 4 | 1 | 25% | 83 |
| 10 | DC | 4 | 0 | 0% | 0 |
Trophy Conversion (Last 4 Years)
IPL Teams Trophy Winning Rating (Last 4 Years)
| Rank | Team | Finals | Titles | Conversion % | Rating |
|---|---|---|---|---|---|
| 1 | RCB | 1 | 1 | 100% | 250 |
| 2 | KKR | 1 | 1 | 100% | 250 |
| 3 | CSK | 1 | 1 | 100% | 250 |
| 4 | GT | 2 | 1 | 50% | 125 |
| 5 | RR | 1 | 0 | 0% | 0 |
| 6 | PBKS | 1 | 0 | 0% | 0 |
| 7 | SRH | 1 | 0 | 0% | 0 |
| 8 | LSG | 0 | 0 | 0% | 0 |
| 9 | MI | 0 | 0 | 0% | 0 |
| 10 | DC | 0 | 0 | 0% | 0 |
Modern IPL Team Rankings (Last 4 Seasons)
Overall IPL Teams Final Rating (Last 4 Years)
| Rank | Team | Total Rating |
|---|---|---|
| 1 | GT | 875 |
| 2 | RCB | 588 |
| 3 | KKR | 660 |
| 4 | CSK | 631 |
| 5 | RR | 490 |
| 6 | PBKS | 398 |
| 7 | SRH | 381 |
| 8 | LSG | 377 |
| 9 | MI | 340 |
| 10 | DC | 181 |
Conclusion: Two Eras, Two Leaders
The IPL All Time Best Team Ranking clearly shows that Chennai Super Kings have been the most consistent franchise in IPL history, dominating categories like win percentage, playoff appearances, and finals qualification.
However, Mumbai Indians remain the most efficient champions, with the best trophy conversion rate.
Meanwhile, the modern IPL era tells a different story, with Gujarat Titans emerging as the strongest team in the last four seasons.
These rankings highlight how the IPL continues to evolve — with historical giants maintaining their legacy while new franchises reshape the competition.
And that is exactly what makes the Indian Premier League one of the most exciting and unpredictable tournaments in world cricket.